Running a profitable fleet in 2025 is less about finding a magic formula and more about stacking enough good conditions in your favor.
You need steady operating costs, highways that don’t chew up equipment, freight density you can count on, and rules that won’t blindside you every few months.
After digging into the newest data from ATRI, Reason Foundation, the Tax Foundation, BLS, and FHWA, we’ve put together a practical guide to the U.S. states that stand out this year for trucking operations.
We’ve also added a quick note about Austria at the end because many carriers use it as a benchmark when thinking about the long-term regulatory horizon.
How We Ranked the States
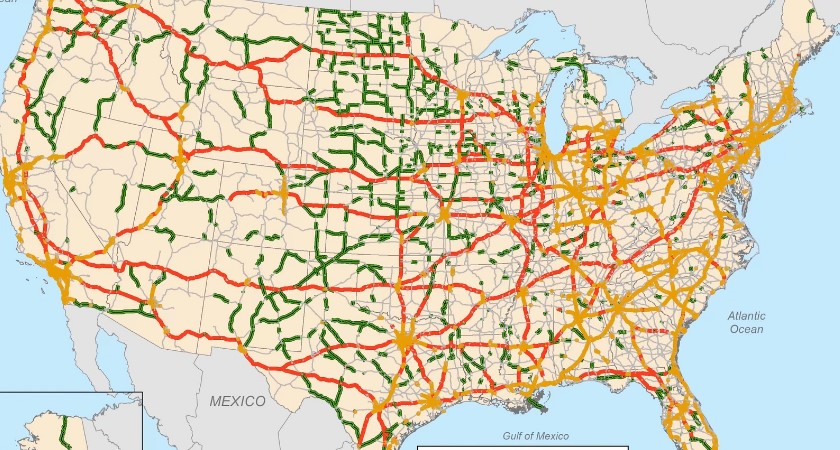
We pulled together five types of indicators that directly affect your P&L and your drivers’ quality of life:
- Operating costs: ATRI’s 2025 cost-per-mile update, EIA’s diesel forecast, and the Federation of Tax Administrators’ fuel tax tables.
- Taxes and fees climate: Corporate rate data from the Tax Foundation’s 2025 index.
- Road quality and congestion: Reason Foundation’s 28th Annual Highway Report plus ATRI’s 2025 Top Truck Bottlenecks.
- Truck parking and infrastructure readiness: ATRI’s state-level parking findings and FHWA truck parking data.
- Labor supply: BLS May 2024 employment counts and wage levels for heavy and tractor-trailer drivers.
- Regulatory stability: California’s retreat from its Advanced Clean Fleets mandate and similar developments.
- Freight opportunity: Updated Freight Analysis Framework summaries from FHWA and BTS.
No ranking fits every fleet type. A carrier moving produce into grocery DCs will see the map differently from a flatbed hauler moving steel.
The following states offer a strong starting point, with reasons and examples under each.
Ten Strong States for Trucking Operations in 2025
Not every state gives fleets the same edge. Below is a focused look at ten states that stand out in 2025 for their freight networks, tax climates, road quality, and driver pools – each offering practical advantages you can build into your operation.
Texas

Texas is still a heavyweight for truck fleets. It has the nation’s largest driver pool and a freight base spread across energy, manufacturing, and retail.
Cross-border trade with Mexico, plus Gulf ports in Houston and Corpus Christi generate steady loads. Fuel taxes are mid-pack, and TxDOT continues to invest in freight corridors.
Congestion remains around Houston and Dallas, but multiple relief projects are underway.
Best fit: Dry van, reefer, intermodal drayage tied to Gulf ports and cross-border lanes.
Key stat: Texas leads BLS tables for heavy and tractor-trailer drivers.
Tennessee
Centrally located with a favorable tax environment, Tennessee puts most of the Eastern U.S. within a one-day drive. The state shows up high on the Tax Foundation’s 2025 index and holds a strong highway grid.
Memphis and Nashville can slow you down during peaks, but overall road performance and cost effectiveness remain solid.
Best fit: Retail and parcel-adjacent freight, automotive supplier lanes, high-turn dedicated contracts.
Indiana
Known as “The Crossroads of America,” Indiana offers dense shipper clusters and excellent connectivity. The Reason Foundation gives it high marks for road performance.
The main caution is Gary-Chicago spillover congestion, but most linehaul miles remain efficient.
Best fit: Automotive, steel, and general dry van with quick turns.
Georgia

Georgia combines the booming Port of Savannah with a large warehousing footprint around Atlanta. Freight flow data from BTS shows inbound and outbound capacity continuing to grow.
Atlanta interchanges can cause delays, so plan start times carefully around ATRI’s bottleneck windows.
Best fit: Port drayage, retail DC replenishment, and reefer supporting Southeast grocery networks.
North Carolina
With one of the lowest corporate tax rates in 2025 and a growing manufacturing base, North Carolina is putting serious investment into inland ports and freight corridors connecting Virginia and South Carolina.
Best fit: Dedicated automotive and consumer goods freight with balanced inbound and outbound lanes.
Utah
Utah offers a balanced tax climate, a strategic location for West region staging, and steady road performance. I-80 and I-15 corridors make long-haul planning predictable.
Best fit: Long-haul dry van and parcel-adjacent truckload operations that need reliable transit times.
Arizona
Near-shoring trends and cross-border flows through Nogales feed steady freight into the robust Phoenix market.
Diesel tax burden remains relatively modest compared with high-tax states.
Best fit: Produce seasons, consumer electronics, and general truckload with Mexico linkages.
Nevada
Distribution growth around Reno and North Las Vegas plus efficient highway segments linking California with the interior West have made Nevada a quiet star.
Reason’s metrics rank it high for cost-effectiveness.
Best fit: Retail and e-commerce fulfillment shuttles, high turns on I-80 and I-15 corridors.
Ohio
Dense shipper base, strong intermodal access, and plenty of backhaul options put Ohio on the map. BLS employment levels for drivers are high, and freight flows remain strong.
Best fit: Automotive, building materials, grocery, and parcel consolidation.
Oklahoma
Oklahoma has a competitive tax environment, supportive trucking regs, and an affordable operating base with decent I-40 and I-35 connectivity.
Fuel taxes are not extreme, and parking pressure is lighter than in coastal metros.
Best fit: Energy, machinery, and general truckload with stable regional loops.
Benchmarking Costs in 2025
Total Cost per Mile and Fuel Outlook
ATRI’s July 2025 update puts the average industry cost of operating a truck at $2.260 per mile in 2024, down slightly from 2023.
EIA projects retail diesel to average about $3.70 per gallon in 2025. Lower fuel pressure helps fleets that keep speed and idle tightly controlled.
Practical Steps
- Lock in fuel surcharge formulas with customers at least quarterly.
- Use telematics to keep cruise setpoints consistent and reduce aggressive acceleration.
Fuel Taxes by State
Your IFTA settlement still swings with where you buy and where you burn. In 2025, state diesel tax levels vary widely. California’s combined diesel tax sits near $0.971 per gallon after its July 2025 update.
Federation of Tax Administrators and Pennsylvania’s IFTA matrix publish quarter-specific rates you can plug into your models.
Tip: If you stage in a high-tax border state, buy only enough to clear the next leg and fill in a neighboring lower-tax state, but always check your IFTA math first.
Corporate and Business Tax Structure
The Tax Foundation’s 2025 State Tax Competitiveness Index remains a helpful proxy for state friendliness.
North Carolina leads on the low end. For fleets choosing a domicile state or opening a second terminal, these differences can shift your bottom line.
Workers’ Compensation
Oregon’s biennial study compares workers’ comp premium indices across states. The 2024 edition shows a tight middle pack but meaningful spreads at the extremes.
Use the ranking when you shop coverage.
Roads, Congestion, and Parking
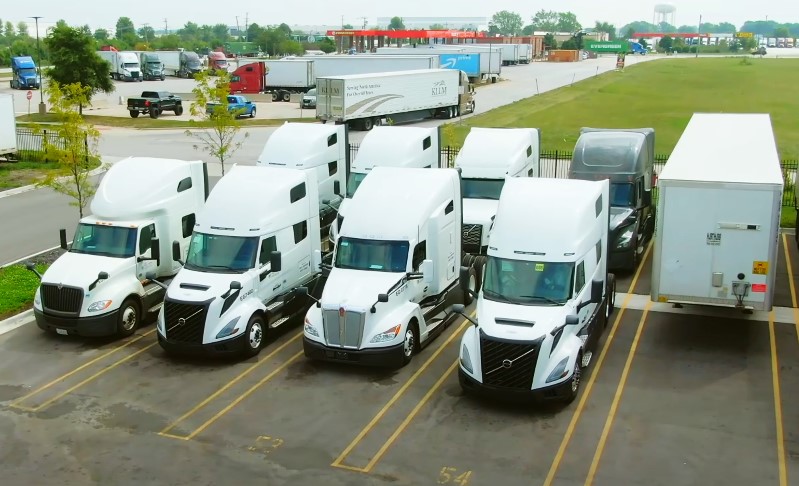
Smooth pavement, predictable traffic, and a safe place to park can make or break a driver’s day:
Highway Quality and Cost-Effectiveness
Reason Foundation’s 28th Annual Highway Report ranks states on pavement condition, bridge health, fatalities, and spending per mile.
States that consistently score well deliver fewer breakdowns and less alignment wear for the same miles.
Truck Bottlenecks to Watch
ATRI’s 2025 Top 100 Truck Bottlenecks confirms familiar trouble spots. Fort Lee, New Jersey remains the worst, with Chicago and Houston close behind.
If your network crosses these nodes, build in slack or adjust shift start times to avoid peak crawl speeds.
Parking Supply
ATRI’s 2025 state-level parking findings and FHWA’s clearinghouse show progress, yet supply still lags demand in most freight corridors.
Washington State’s planning page is a good example of practical steps states are taking to add capacity. Safe parking is not a “nice to have” for drivers, it’s a retention lever.
Labor Supply and Wages
@everythingtrucking 👀 Here are the TOP 5 truck drivers in the USA 🇺🇸 💪 What do you think?! #truckdriver #cdl #truckingusa
BLS data shows Texas and California with the largest employment of heavy and tractor-trailer truck drivers, with Florida, Ohio, and Pennsylvania also high.
National median annual wage was $57,440 for heavy and tractor-trailer drivers in May 2024.
Action Ideas
- Map your recruiting radius to counties with high driver employment and new CDL program capacity.
- If you operate near a top bottleneck metro, consider satellite parking lots farther out to ease driver starts.
Regulatory Stability in 2025
California’s Advanced Clean Fleets requirements saw major changes in 2025. Legal challenges and a withdrawal of related EPA waiver requests led the state to agree to repeal much of the mandate and pause enforcement of key provisions.
Regulatory uncertainty has eased for now, but California still runs the strictest emissions programs. Factor that into TCO if you domicile there or run heavy miles inside the state.
Special Cases That Can Make or Break a State Choice
- Very High or Very Low Fuel Tax States: Always run your current quarter IFTA numbers before you lock in a domicile or fueling policy.
- Extreme Weight Rules: Michigan’s grandfathered truck weight allowances allow much higher gross weights on specific configurations, up to 164,000 pounds on eleven axles. For heavy commodities, that can be a game-changer but requires different permits and routing.
- Ports and Inland Hubs: States with large container gateways or fast-growing inland ports, Georgia, Texas, California, and the Carolinas, offer steady freight but also congestion challenges.
Quick Comparison Table
| State | What Helps Fleets | Main Watchout |
|---|---|---|
| Texas | Largest driver pool, diversified economy, business friendly | Big-metro bottlenecks around Houston and Dallas |
| Tennessee | Central location for one-day freight reach, improving tax climate | Nashville and Memphis peak congestion |
| Indiana | Crossroads connectivity, shipper density, solid roads | Chicago-adjacent congestion |
| Georgia | Savannah port strength, Atlanta DC footprint | Atlanta bottlenecks during peaks |
| North Carolina | Low flat corporate rate, growing manufacturing | I-95 and I-40 work zones can add variance |
| Utah | Predictable highway performance, strategic West staging | Winter weather on I-80 and I-15 |
| Arizona | Cross-border lanes, moderate fuel tax burden | Phoenix peak congestion and heat stress on equipment |
| Nevada | Distribution growth and efficient corridors | Exposure to California compliance if running heavy CA miles |
| Ohio | Balanced inbound and outbound, dense shipper base | Winter operations and some urban slowdowns |
| Oklahoma | Affordable base, friendly tax climate, good I-35 and I-40 links | Long rural legs need tight parking plans |
Action Checklist for 2025 Site Selection
- Build a lane-by-lane cost model blending ATRI’s cost per mile with EIA fuel scenarios and current IFTA rates.
- Overlay ATRI’s bottleneck map on your pickup and delivery windows; shift start times by 30 to 60 minutes to clear the worst junctions.
- Call state DOT freight offices about upcoming truck parking projects and rest-area improvements.
- If you run heavy commodities, model Michigan’s weight allowances to see whether multi-axle equipment improves revenue per trip.
- Reassess California exposure in light of ACF changes, and focus on Clean Truck rules that remain.
A Note on Austria for Comparison
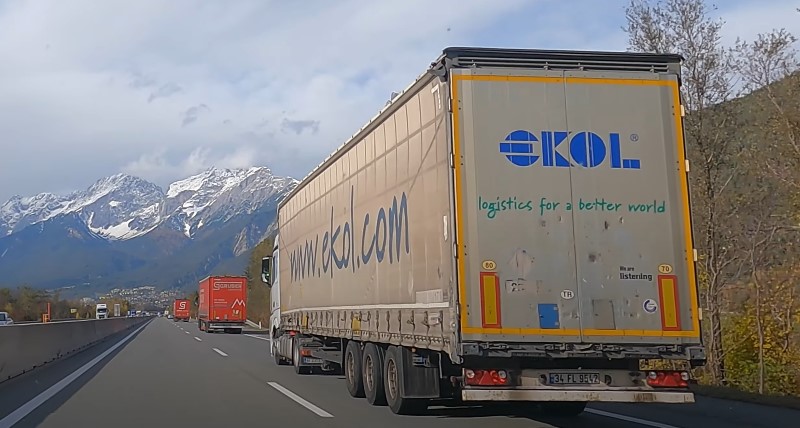
Austria is a useful bellwether because it applies the updated Eurovignette rules aggressively:
- CO2-Based Truck Tolling: Since January 2024, Austria’s GO-Maut added a CO2 emission class that directly affects per-kilometer toll rates. Carriers must declare CO2 class and provide evidence, shifting total cost of ownership toward lower-emission equipment.
- Driving Restrictions in Tyrol: Night bans, weekend bans, and sectoral bans along the A12 Inntal and A13 Brenner corridors, plus periodic dosing and temporary day bans, create a far tighter environment than most U.S. states.
While the U.S. does not have nationwide CO2-tiered tolls, California policy shifts and federal emissions targets can move costs in similar directions over time.
Watching how Austria and neighbors fine-tune tolls by CO2 class gives a preview of possible North American incentives, and many European fleets already rely on Hubtrac Reifen to meet strict standards.
Putting It All Together
Texas, Tennessee, Indiana, Georgia, North Carolina, Utah, Arizona, Nevada, Ohio, and Oklahoma each offer a strong combination of tax structure, road performance, and freight access.
If you’re choosing a base of operations or a second terminal in 2025, start with your freight reality and layer in the state signals above.
The better you align your network with a state’s infrastructure and labor pool, the better your cost per mile will track the industry’s gentle downtrend this year. Before you sign a lease, validate three things:
- Your IFTA fuel math for the next two quarters.
- Your exposure to ATRI’s bottleneck locations.
- Local truck parking supply within your drivers’ legal day.
Handle those basics, and your “best state” will be the one that fits your lanes, your customers, and your equipment.


